100-sample E. coli Case Study
This worked example shows Speccheck on a realistic cohort rather than a toy fixture. The input reads were processed through GHRU Assembly and the compact published QC outputs were summarised with Speccheck.
The committed example is intentionally compact. It includes reports, accessions, analysis tables, figures, and provenance; it does not include raw reads, assemblies, databases, or Nextflow work directories.
Files to look at
| Path | What it is |
|---|---|
examples/qualibact_ecoli/real_run_100/cohort_accessions.csv |
selected accessions and metadata |
examples/qualibact_ecoli/real_run_100/report/report.csv |
compact Speccheck cohort report |
examples/qualibact_ecoli/real_run_100/report/report.full.csv |
wide report with parser/provenance columns |
examples/qualibact_ecoli/real_run_100/report/report.html |
interactive review report |
examples/qualibact_ecoli/real_run_100/analysis/tier_concordance.csv |
historical tier vs current compatibility tier |
examples/qualibact_ecoli/real_run_100/analysis/discordant_samples.csv |
samples where tiers differ |
examples/qualibact_ecoli/real_run_100/analysis/summary.json |
provenance and headline counts |
What the example demonstrates
The case study demonstrates three things:
- Speccheck can summarise outputs from a real workflow run.
- The final report is small enough to commit and review.
- Threshold provenance is explicit: the report records Speccheck version, criteria path, criteria checksum, and threshold source.
Results at a glance
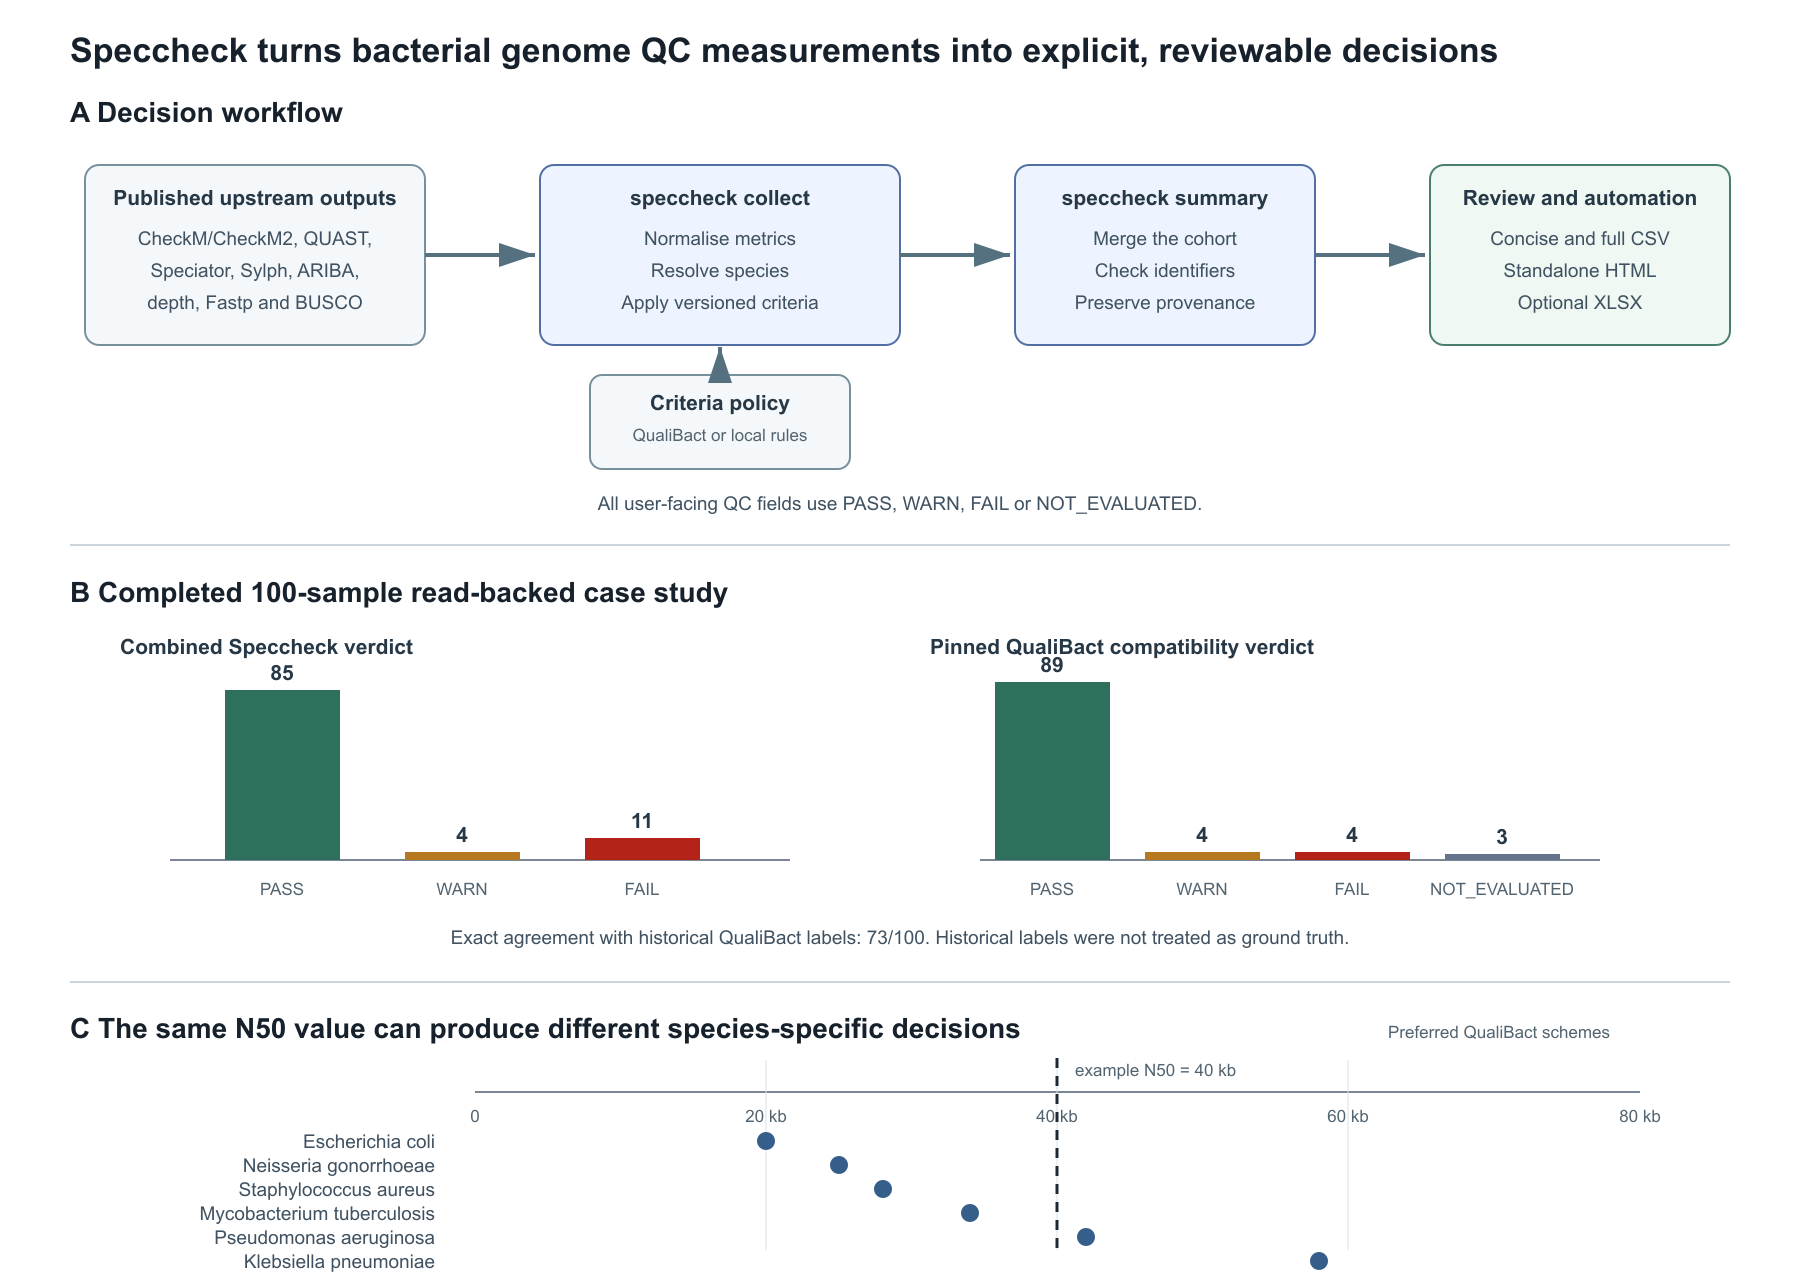
The completed 100-sample run produced:
- 89 current compatibility PASS samples;
- 4 current compatibility WARN samples;
- 4 current compatibility FAIL samples;
- 3 current compatibility NOT_EVALUATED samples;
- 73/100 exact tier agreement with the historical labels;
- 3 samples with unidentified Speciator results.
These values describe concordance between historical labels and current measurements. They are not sensitivity or specificity estimates, because the historical labels are not treated as ground truth.
The publication figure combines the decision workflow, the combined and QualiBact-specific verdict distributions, and the species-specific N50 example:
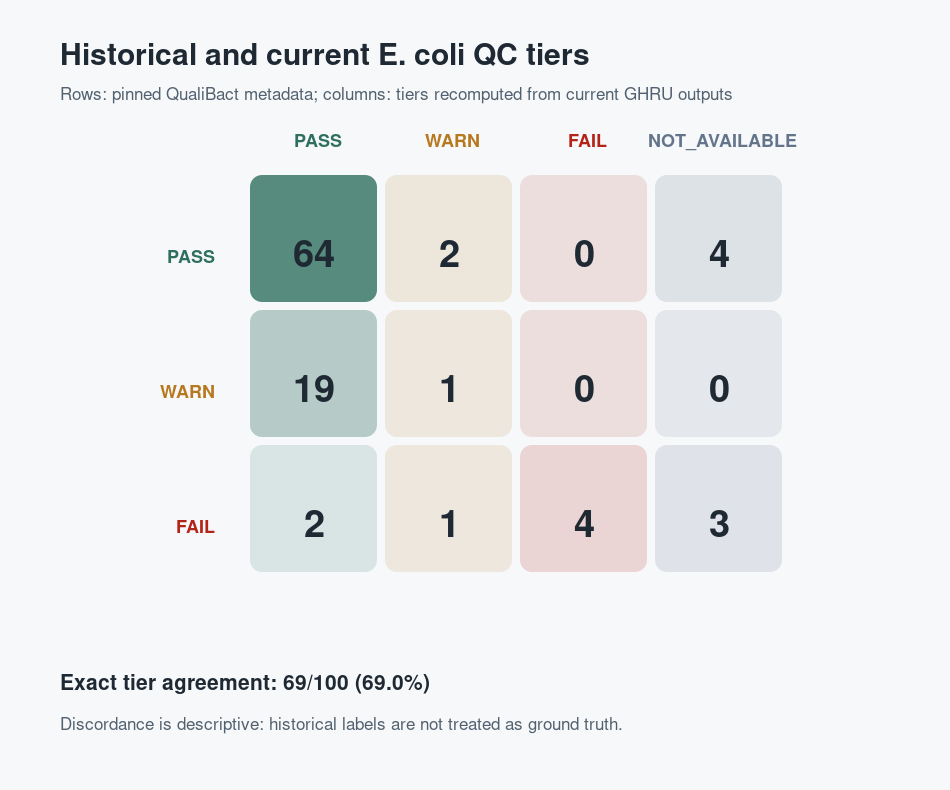
The compatibility overlay applies the pinned E. coli QualiBact threshold set to
E. coli and Shigella assignments. The 3 unidentified assemblies remain
NOT_EVALUATED; Speccheck does not assign them an E. coli compatibility tier.
Metric distributions
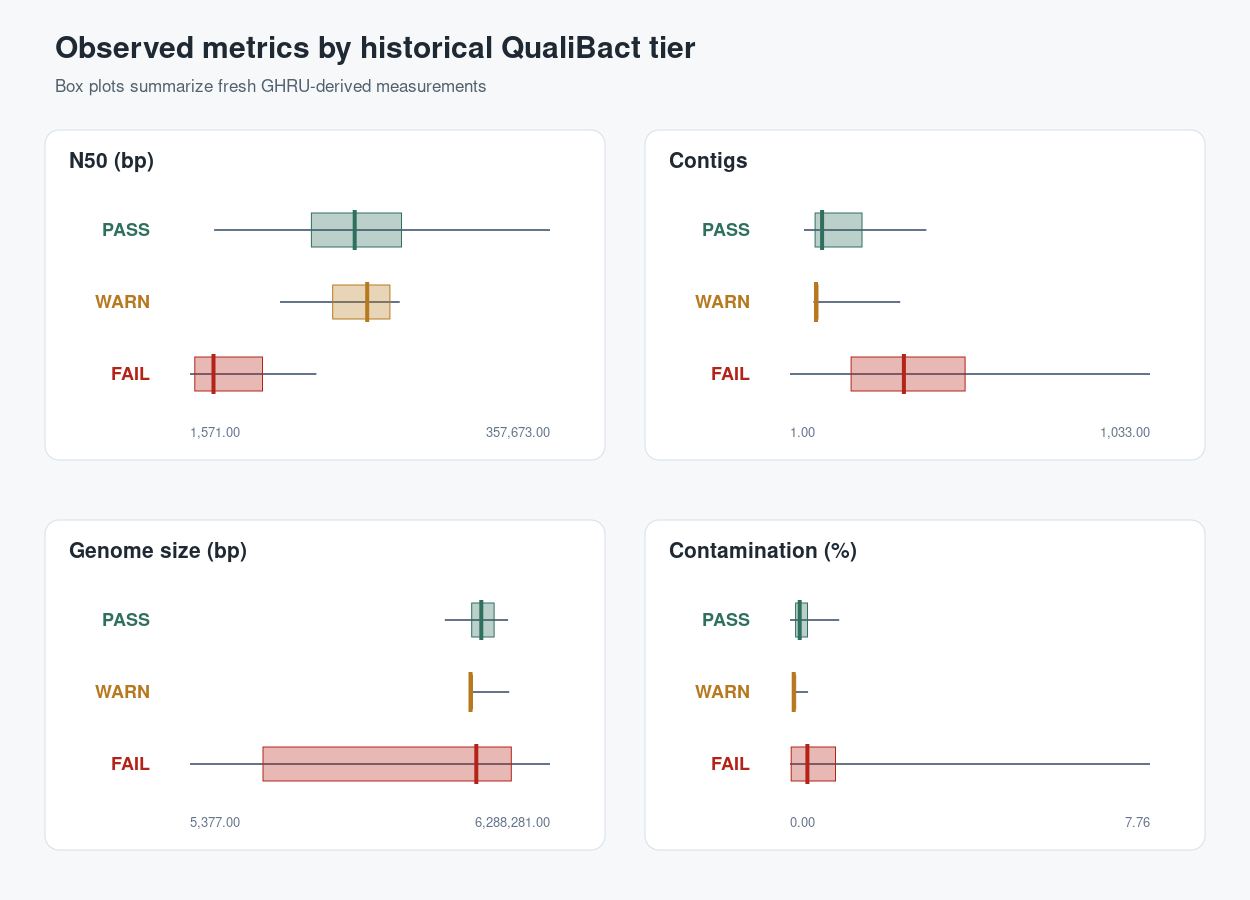
The metric distribution figure is useful for seeing why WARN/FAIL decisions happen. It highlights assembly and contamination metrics by historical tier.
Report snapshot
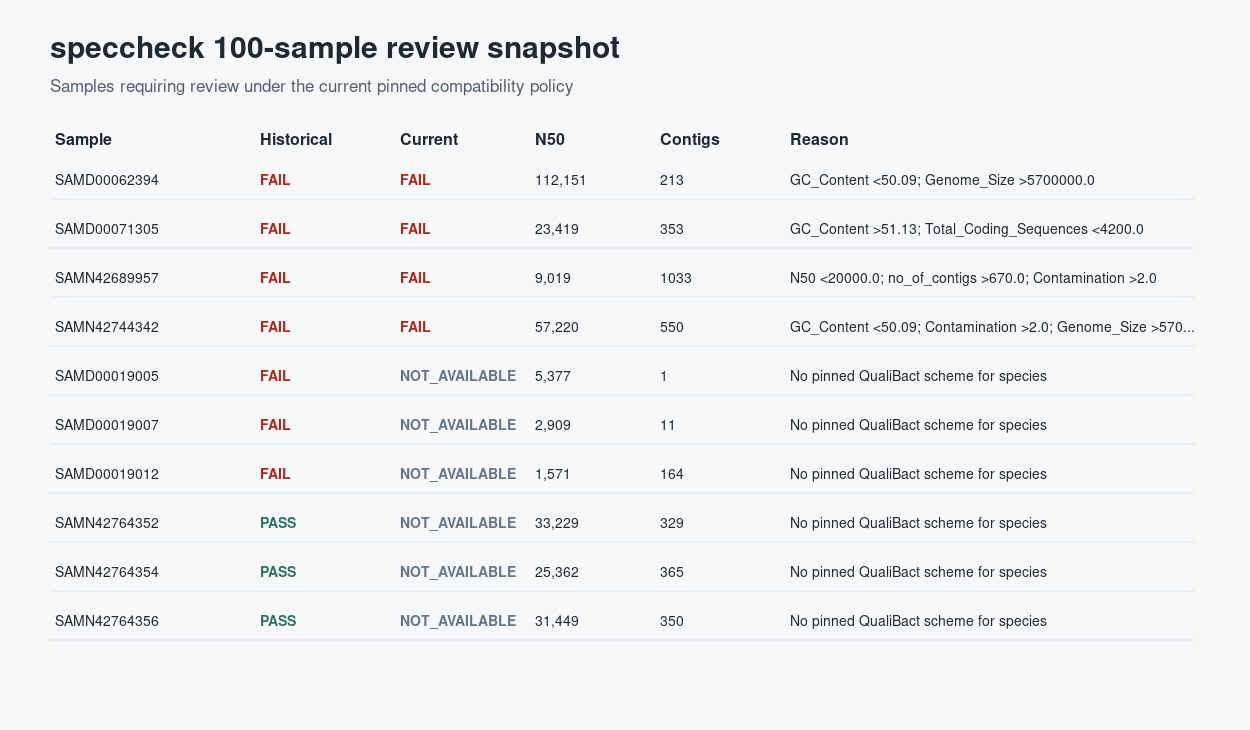
The HTML report is intended for interactive review. It opens on an exception-first review queue with sample-detail dialogs. Cohort summaries, per-tool diagnostics, and the full provenance table remain collapsed until requested, with persistent desktop navigation and a compact mobile jump menu.
Recreate derived assets
pixi run python scripts/create_real_run_100_assets.py
This regenerates the derived analysis CSVs, figures, and provenance summary from the committed report files.
Interpretation boundary
The compatibility overlay is pinned to QualiBact E. coli v1. It should not be described as general multi-species QualiBact parity. Other species may have different threshold versions, different available metrics, or no species-specific threshold for a given metric.